SA’s Top Hijacking Hotspots You Need to Know!

June 14, 2017
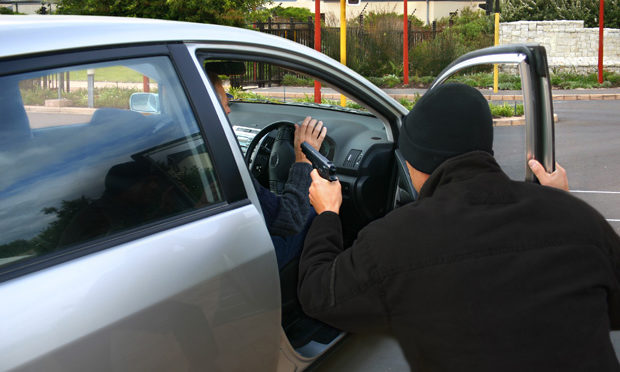
The threat of hijacking and theft is a bane for South African car owners. We try to continually educate ourselves on trends and hotspots to protect our vehicles and ourselves.
To help with this, CompareGuru spoke to vehicle tracking company Ctrack to find out some of the latest trends that they have observed among their customers.
The company provided some of its recovery statistics for May. So what did these statistics an figures reveal?
Top Provinces For Theft And Hijacking In May
The provinces that saw the highest incidents of theft and hijacking in May are also the most populated in South Africa.
According to Ctrack, based on customer stats, the provinces are listed as follows:
- Gauteng
- KwaZulu-Natal
- Western Cape
- Mpumalanga
Statistics for 2016, provided to us by Netstar, another vehicle tracking company, show a similar trend. The top three provinces for hijacking and these for their subscribers were:
- Gauteng – 54%
- KwaZulu-Natal– 26%
- Mpumalanga – 6%
Looking at CrimeStatsSA, a site which records and graphically represents crime in the country, Gauteng is listed as the province with the highest number of hijackings. KZN was in second place. These rankings also applied to vehicle theft statistics in the country.
While Ctrack and Netstar’s statistics are based on their subscriber bases, they line up quite closely with national crime statistics.
What About Hotspots?
We’ve looked at the provinces with the highest hijacking numbers, but what about hotspots within these provinces?
Ctrack provided the statistics for risk areas in May 2017, based on incidents involving their subscribers.
So what do the statistics show?
Gauteng
For Gauteng, the highest risk areas in May were:
- Honeydew
- Roodepoort
- Booysens
- Brooklyn
- Boksburg
- Alberton
- Linden
- Krugersdorp
- Kempton Park
- Johannesburg Central
Most of these areas are part of the larger Johannesburg area, including the East and South Rand.
In terms of the riskiest time of day, Ctrack found that most incidents affecting their customers happened between 6pm and 12am. The time period with the fewest incidents was 12am to 6am.
Western Cape
When it comes to the Western Cape, the high risk and lower risk time frames are the same as Gauteng. But what are the province’s high-risk areas?
The Western Cape’s high-risk areas in May were:
- Bellville
- Parow
- Mitchells Plain
- Cape Town Central
- Goodwood
- Milnerton
- Woodstock
- Claremont
- Kraaifontein
- Athlone
Other high-risk areas included Brackenfell, Nyanga, Stellenbosch, Table View, Kuilsrivier, Dieprivier, Wynberg, Lansdowne, Delft and Grassy Park.
While many of Cape Town’s “red zones” were included in the list, such as areas within the Cape Flats, there were also inclusions among areas considered relatively safe.
Claremont and Wynberg, for example, are within Cape Town’s Southern Suburbs – which are often considered some of the safest areas in the city. Perception obviously doesn’t always match up with reality.
On the other hand, Ctrack’s stats are a snapshot. But it is useful information to know for those who would normally let their guard down in these areas.
Kwa-Zulu Natal
High-risk areas and times for KwaZulu-Natal were also detailed in Ctrack’s May statistics.
The company named KZN’s high-risk areas as:
- Berea
- Durban Central
- Umbilo
- Phoenix
- Chatsworth
- Pinetown
- Amanzimtoti
- Greenwood Park
- Mayville
- Durban North
KZN deviated from the other provinces in terms of the peak times of incidents. Rather, the highest incident time frame is 6am to 12pm, while the lowest incident time frame was 12pm to 6pm.
Is The Situation Getting Worse?
To determine whether hijacking is on the rise, you will have to look at the national statistics.
Netstar, however, has noted an increase in hijackings over the last few months, with May being the worst month this year.
Ctrack, on the other hand, saw a peak in March and a dip in April.
Also read: CompareGuru’s 5 must-have cars for new drivers
This is, of course, related to their subscriber base, rather than general residents.
So What Does Government Say?
The 2015/2016 crime statistics report showed an increase in hijacking incidents from the previous year.
The stats report showed a significant increase of 14.3% when compared with the previous period.
In fact, the number of carjackings in 2015/2016 was the highest seen since the 2009/2010 report.
Provinces also saw significant increases in carjacking incidents, with only the Free State decreasing.
Gauteng saw an increase of 7.3% while the Western Cape saw an increase of 32.8%.
The province that saw the highest increase in carjackings was the Northern Cape, with a 213.3% increase – however, this figure is less alarming when looking at total hijackings versus the percentage increase. The Northern Cape saw an increase from 15 carjackings in 2014/15 to 47 in 2015/16.
Gauteng, on the other hand, saw an increase of around 500 hijacking incidents – similar to the increase seen in the Western Cape.
This above content was supplied by CompareGuru.
To compare a variety of car insurance quotes click here